Monday, May 30, 2022

With Bands Like The Warning, Rock Can Turn The Corner

In the spring of 1997, my manager at my job tells me "A fraternity brother from college is on the management team for Better Than Ezra. They're on a club tour and they're gonna be in town soon. He says I can have up to ten tickets. Wanna go?"

My answer: "Sure!"

So, a couple of weeks later, I'm in a bar on Huger Street in Columbia, South Carolina, drinking Shiner Bock and watching Better Than Ezra belt out hits like King Of New Orleans and Desperately Wanting with my manager, his buddy, and a few hundred others.

That was my last rock concert... my last one until the Friday before Memorial Day, 2022.

What act brought me out of rock concert retirement after 25 years, 8 address changes, two career changes, a second college degree, a wedding, that bride's funeral, another wedding, and becoming a father of twins?

The Warning: three sisters from Monterrey, Mexico... none of whom were born when the doorman took my ticket at that South Carolina bar a quarter century ago.

How did they do it?

Simply put, they -- 22-year-old Daniela (Dany), 20-year-old Paulina (Pau), and 17-year-old Alejandra (Ale) --  are the real deal at a time when rock can use a few more real-deal bands (more on that later).

When I hear them, I hear extraordinary, guitar-driven rock. Full stop. It's amazing on its own merits -- this band does not want or need any special consideration because the band is all women or because they were all born in the 2000s or because their first language was not English (they mostly perform in English; two songs that routinely make their concert playlist are in Spanish). Their music both is true to the brand of rock grandfathered by Led Zeppelin and Black Sabbath and having been upheld by Van Halen, AC/DC, Metallica, and Foo Fighters plus it carries the unique stamp of the talented women who wrote and performed it. 

The only song on their playlist that they didn't write: an authorized cover of Metallica's Enter Sandman... which was recorded (with Alessia Cara) for Metallica's 2021 Blacklist album.

The Warning's concert material includes their current Mayday EP, produced by David Bendeth, plus earlier songs they independently produced prior to signing with Lava Records. As talented performers in a cohesive band, they create tremendous musical depth with just three instruments plus their three voices. I couldn't swear in a court of law that all the songs I heard in their show at The Rebel Lounge in Phoenix on May 27 had zero pre-recorded material, but I could swear 85% of the songs were strictly what Dany, Pau and Ale brought to the stage in that moment.

I used to be in TV news; I had to learn NOT to write long. I could try to write hundreds of words explaining the magic when Dany straps on her custom Paul Reed Smith guitar and steps up to the mic... hundreds more on Pau's brilliance as a songwriter, drummer, singer, and, as needed, screamer... and hundreds more on how Ale is both a rhythmic and tonal backbone of the band plus rock-steady at harmony lyrics.  But that would be wasting everybody's time -- mostly mine. 

YouTube tells that story far better than I could. It would take you less than 24 minutes to watch all 6 of their official music videos in their official music videos playlist, plus another 4 minutes to watch Z, the song with which they open most of their concerts and the only song from their 2021 EP Mayday NOT to have an official video. Their YouTube channel also contains a considerable number of clips from the 24 live shows they headlined in the 40 days prior to their stop in Phoenix.

If you spend a half hour listening to their studio material -- then at least another 15 minutes on their live material (I recommend this clip from the famed Troubadour in Los Angeles earlier in May -- I dare you to tell me that you don't hear what I hear.

Perhaps no better endorsement of the band comes from the late Taylor Hawkins, given backstage when The Warning opened for Foo Fighters in Mexico City 10 days before the beloved drummer passed away. 

- - - - - - - - -

I've been a huge fan of rock roughly since late summer of 1980. I come from a place too rural and remote to have had a rock radio station available to me on either radio dial as I started 7th grade that August.  Early that school year, one of my classmates was being dropped off at junior high by his high school senior brother.  What was coming out of the cassette deck of the stereo of his refurbished late-60's Mustang?  Side 2 of AC/DC's one-month-new album Back In Black. 

How could I NOT get hooked?!?  It was loud and badass and infused with the dark backstory of their late lead singer Bon Scott's untimely and mysterious death. It intrigued me and a substantial number of boys my age on at least 3 continents... and has kept intriguing fans through the years to make it the world's best-selling album of original music by any artist not named Michael Jackson.  

The world we live in today, empirically, does not find rock to be intriguing.  

One friend of the aforementioned David Bendeth is rock jack-of-all-trades Rick Beato, whose main YouTube channel has almost 3-million subscribers.  Beato hosted a half-hour livestream this past winter entitled "Will Rock Music Ever Come Back?"

The very-credible title in and of itself indicates rock has seen better days.  In the video, he shows a graphic of a year's worth of Google searches by music genre.  Rock gets half the search traffic of country and only one-fourth of the traffic of hip hop.  Beato cites a musicbusinessworldwide.com article indicating barely more than one fourth of all music consumed in the US is new releases.

Beato doesn't really go about answering the question as much as he does illustrating the reality in which rock finds itself in 2022 -- the reality as expressed by the consensus of many music-business friends he met on a recent trip to New York.

Among the items of consensus:

  • The most newly-created really big rock & roll rock star (i.e. Beato would call Billie Eilish a rock star, and I would call Lin Manuel Miranda a rock star; neither are rock & roll rock stars) is Dave Grohl, who was born in 1969.
  • There are no stars (for young people) to imitate. Dave Grohl may be a rock star, but not many teens want to emulate him.  Young people of today don't see themselves in him.
  • Young people don't want to learn instruments.
  • All forms of music are competing for the attention of young people with video games.

This video came out before Taylor Hawkins passed away. So, not only is the world's newest rock star and current rock standard bearer in his early 50s, Dave Grohl's band, for the most understandable reason in the world, is inactive at the time of this writing.

So in the absence of a Rick Beato answer to that question, I will attempt to offer one in the context of the consensus items I described above.

My answer: rock will rise or fall based upon how well young people (in the USA and elsewhere) see themselves and their experiences reflected in the work of current and emerging rock bands which will need to reach those young people in the ways that they consume media.

Rock and roll is floundering, in part, because it's not nearly as diverse as other modern music genres.  The makers of rock are, relative to country, pop, and hip hop, a boys club.  Rock's audience is heavily white, heavily anglophone, and aging.

For rock to thrive again, it needs to appeal to women, minorities, people born in or shortly before the 21st Century, and people who may not speak English (or only speak English part-time).  As The Warning itself is all of those things, the band uniquely is positioned to make inroads here.  Pau's lyrics are the angst of her generation -- including how greed and unchecked power damage the world she and her peers soon will inherit from folks like me.

Forty years ago in March 1982, the album Beauty And The Beat by The Go-Go's became the first album to hit #1 on the US Billboard Hot 200 album chart where all of the music was written and performed by women.  Do you know what the second such album was?  Trick question; it hasn't happened yet.  It's not fair to put the blame for that on the Go-Go's... but it's fair to say the Go-Go's didn't have any meaningful coattails. I turned 14 while their album was #1, I don't remember girls my age telling me "I want to be like Belinda Carlisle or Jane Wiedlin." 

The Warning might have some coattails. While most of the venues of The Warning's recent tour were bars, there were a lot of all ages shows during this tour. While the typical member of the crowd was a man roughly my age, several of those men brought teen and pre-teen daughters... and a number of those say they've have been inspired to learn instruments and sing (and, judging by my own children, teen girls are a bit less enamored with video games than their male peers).

When Nirvana put Dave Grohl on the journey to becoming a rock star, the path to stardom in his genre had been stable for awhile: get as much play as possible on what was then known as album-rock radio and on MTV (a plurality of its programming in 1991 still was music videos). That's not where young people get their music today and it's definitely not where they encounter and sample music of artists they haven't encountered before. The Warning, its members, and its management certainly are social-media savvy and are working it to cultivate a connection to fans and prospective fans.

The task ahead for rock to remain a relevant and vibrant art form, especially as the world's remaining rock stars age or move on from this life, might be captured in this verse and chorus from a track off of The Warning's latest EP:

Dry my tears cause I’m a weapon. 
Weapons never weep.
I’m not in danger.
I’m the danger.

Start the clock and keep it running
It’s the one to beat.
I’m not in danger.
I’m the danger now.

I’ll show you what it means to change

Help me become something
More than just a vessel in disguise.
Pain is the price to survive
To evolve

The world of rock will need to be bold, and promptly, to change in ways to assure the genre's future.

It's a future The Warning definitely is ready to become a key part of.

Sunday, March 29, 2020

What A Difference 20 Years Makes

Changes in the NFL's All-Time Pecking Order

It's a good time to illustrate changes to All-Time NFL Franchise Win-Loss-Tie% since the end of last century for a number of reasons.

1) The NFL's 100th season just ended.
2) The 8 original AFL franchises, plus Dallas, each have finished their 60th season
3) Since the end of 1999, the Brady/Belichik era has come and gone in New England.

*The franchise rankings of the 4 newest NFL franchises (for recordkeeping purposes, the NFL treats the Baltimore Ravens as an expansion franchise) were not considered, as they had played so few games in the 1900s (the Texans had played none at all) -- comparisons would not have been meaningful.

TEAM

 ATW%
 @'19 

 ATW%
 @'99 

 Rank*
  '19  

 Rank*
  '99  

 Change 

The Top 15 -- Now vs. Then
Dallas  .572   .598   1   2   +1 
Green Bay  .567   .551   2   8   +6 
New England     .564   .469   3   20  +17 
Chicago  .563   .585   4   5   +1 
Miami  .552   .605   5   1   -4 
Minnesota  .547   .563   6   7   +1 
San Francisco  .543   .576   7   6   -1 
New York Giants  .533   .545   8   9   +1 
Pittsburgh  .533   .493   9   15   +6 
Denver  .533   .513   10   13   +3 
Kansas City  .532   .539   11   10   -1 
Indianapolis  .528   .486   12   18   +6 
Raiders  .522   .593   13   4   -9 
Seattle  .514   .465   14   21   +7 
Cleveland  .509   .597   15   3   -12 

Other noteworthy items:

1) The franchises that had existed from the 1980s onward that had the 4-worst all-time winning percentages of the 1900s all appeared in at least one Super Bowl in the 2000s: Tampa Bay, New Orleans, Atlanta, and Arizona.

2) The Arizona Cardinals hold the dubious distinction of being the most-consistent team between the 1900s and the 2000s: .423 Win% in the 1900s, .431 Win% in the 2000s, .008 difference the smallest of the 28 teams that have existed 30+ years.

Tuesday, December 25, 2018

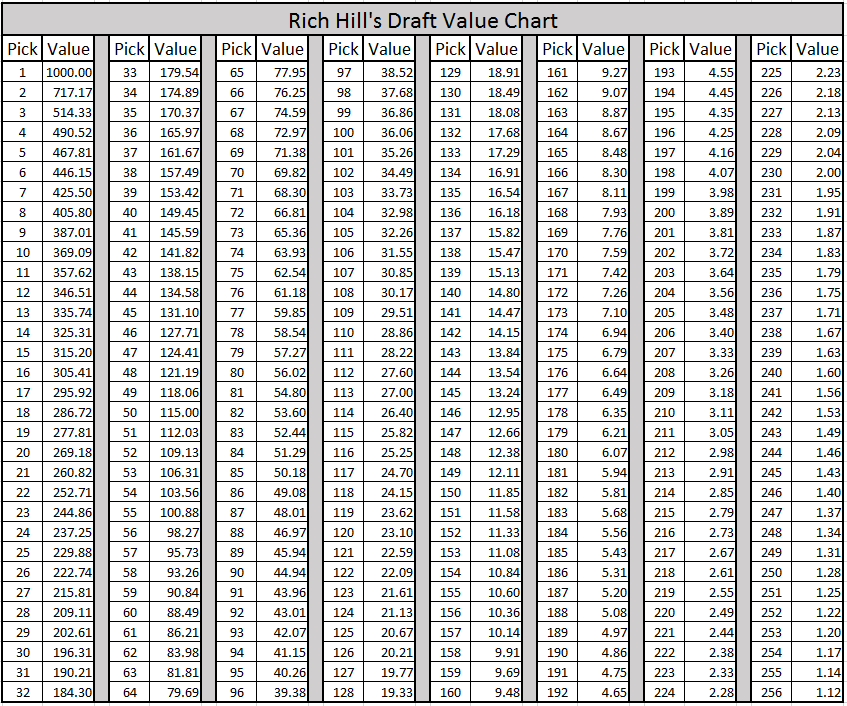
NFL Draft Pick Trade Value Calculator

This calculator compares values of two-team draft-pick-only trades and calculates the gain and loss for each trading partner. Trade values come from the chart created by Rich Hill of Pats Pulpit (used entirely without permission) and multiplying them by 100 (to keep the values whole numbers).

The trade values from the chart are not the be-all-end-all of trade values. As Hill explains in his article, each team uses variations of this chart. Also, trades into the Top 5 vary widely from year to year based on the perceived quality of the best-of-the-best draft-eligible college players (especially if one or more potential ''franchise quarterbacks'' are in the draft).

# Team A Team B
1
2
3
4
5
6


The following table indicates the cumulative point values of each team's draft picks as of February 23, 2019.
Number of picks includes compensatory picks.
Relative Power equals the team's cumulative point value divided by the league average.

Draft order is taken from tankathon.com and is subject to change based on trades.

TeamPower
Points
2019
Picks
Relative
Power
Arizona13266511230.3%
Oakland12449110216.1%
San Francisco1001827173.9%
Green Bay8144310141.4%
Tampa Bay737936128.1%
Jacksonville729657126.7%
New York Giants7005410121.6%
New York Jets679116117.9%
Buffalo6789310117.9%
Detroit645539112.1%
Denver633938110.0%
Cincinnati6284311109.1%
Indianapolis584149101.4%
Atlanta580129100.7%
Cleveland573021099.5%
Washington56842998.7%
Carolina56758798.5%
Miami55925797.1%
New England526051191.3%
Houston51451789.3%
Minnesota49034885.1%
Philadelphia48345883.9%
Tennessee47806683.0%
Pittsburgh46684781.0%
Kansas City43113874.8%
Baltimore40476870.3%
LA Chargers37378764.9%
Seattle34295459.5%
LA Rams29817751.8%
Dallas18375631.9%
New Orleans10555618.3%
Chicago8136514.1%

Monday, October 15, 2018

Arizona's Proposition 127 -- It Could Cost A Lot Less Than APS Advertises

Arizona Voters will decide upon Proposition 127 this November. It's a proposition which would require utilities to get 50% of their electricity from renewable non-nuclear sources by 2030.

The principal force in the advertising campaign against Proposition 127 is Arizona Public Service (they've provided 98%+ of the funding for the entity nominally paying for the TV ads).

Their principal scare tactic is to tell Arizonans an average electric bill will go up $1,000 per year.

I've done some back-of-the-envelope calculations indicating it should not cost nearly as much.

Assumptions


Arizona can exceed the Prop 127 renewable standard by taking these 5 steps.

1) Cover the entire Central Arizona Project (CAP) Canal (Arizona's single-largest electrical customer by far) with solar panels.

2) Cover the roofs and parking lots of non-residential real estate (including apartment complexes) to the tune of the land area of 25 times all of Arizona's Wal Mart stores (and their parking lots) with solar panels.

3) Cover 25% of the space underneath APS' 6,000 miles of high-voltage power lines, plus the land associated with any fossil-fuel power plants to be decommissioned, with solar panels.

4) Cover every single-family home in Maricopa, Pima, Pinal and Yuma County not currently covered in solar panels with solar panels.

5) Installations would occur gradually over time, commensurate to worldwide solar panel production.

Who would pay?

Let's break it down by the steps listed above:

Central Arizona Project


Why, the Central Arizona Project, of course. How much would it cost CAP water users? Little or nothing.

Why? Beginning in 2019, CAP's principal source of electricity, Navajo Generating Station, is expecting to charge them $60 per megawatt hour (MWh) for power. Utility-scale solar (the scale of solar installation it would take to cover 200+ miles of canal) already costs so little, the unsubsidized price of its electricity is less than $60 per MWh. The Department of Energy's (DOE) target price for solar-produced electricity in 2030: $30 per MWh. The DOE hasn't missed a long-term solar-energy price target this century.

Solar makes business sense for CAP.

Non-Residential Property


Why, the property owners, of course. How much would it cost property owners? It actually would save them money. They might even be able to pass along lower costs to their customers. Here's how.

The average price for which APS sells a MWh of electricity at retail prices is $121.40 (12.14 cents per kWh). Commercial-scale solar (the scale of solar installation it takes to cover each of 125 Wal Marts and their parking lots x 25) already costs so little, the unsubsidized price of its electricity is about $103.30 per MWh. Long-term, $90 per MWh is very realistic.

Again, this is good for business for all land-using businesses.

APS Own Property


Why, APS, of course. How much will they sock it to their customers to pay for it? They shouldn't have to charge anything? Why?

Remember that DOE price target of $30 per MWh? It costs APS about $40 per MWh just to put fuel in coal and natural gas plants -- at today's fuel prices. Before 2030, it'll be cheaper to build solar than to fuel polluting plants.

Installing solar would be good business for APS.

On Homeowners Property


This the only place that gets a bit dicey. There are federal tax subsidies for solar installation, but there's no real guarantee they'll persist. And right now, the unsubsidized price of residential solar is slightly higher than what APS charges.

For 12% of APS* gross revenue (almost all of which comes from selling electricity on the retail market) for each of the next 12 years (2019 thru 2030), they could subsidize residential solar on a declining basis (about 20% of the cost in 2019 -- down to about 12% of the cost in 2030)... bringing the unsubsidized cost of the electricity to around $101 per MWh -- enough cheaper to spur homeowners to take the plunge on solar.

*APS subsidy would only be for customers in its service area; SRP and TEP would need to do the same thing.

If APS had to pass costs equal to 12% of their gross revenue on to rate payers, they'd do so by increasing rates by, you guessed it, 12%.  The average Arizona electric bill is around $1500 per year. If you live in an all-electric house in metro Phoenix, keep your 1800-square-foot house at 75 degrees all day (because people are home) and you have a swimming pool (pool pumps eat electricity like crazy), $3000 per year would be typical.  A 12% bump in the average bill would be $15 per month; $30 extra per month in a high bill.  A far cry from $83 per month ($1000 per year) they've advertised.    

Then What's The Downside?


The main downside would be to APS. They'd be selling about half the electricity they do now (because the other half would be produced on site and used by the property owners). Thus, they'd be in a position to command much much less revenue. Their shareholders would raise a stink. 

APS would employ somewhat fewer people, but those job losses would be more-than offset by the job gains required to install enough solar panels to cover 50,000 football fields in just 12 years.

Some of APS job losses could be offset by the need to create massive banks of utility-scale power-storage (something APS would have expertise in doing), so electricity generated at noon could be used at midnight.  By 2025, industrial lithium batteries should break the $60,000-per-MWh price barrier.  For the life of those batteries (if charged and discharged carefully), one could store electricity for as little as $20 per MWh (2 cents per kWh). 

So long as APS owns and operates Palo Verde, they will be in a position to be a net seller of power to other utilities. Even with as little solar power in place as is in place now, the wholesale price of electricity often falls below 2 cents per kWh.  With more solar in place and more battery-storage in place -- it becomes attractive to, instead of selling that power to some other utility at less than 2 cents per kWh, they store the electricity for 2 cents per kWh and sell it wholesale for more than 4 cents per kWh (which is still less than the fuel cost of fossil plants) or retail it for 12 cents per kWh.  That makes business sense. In time, APS management will make its shareholders' happy.

---

But what is our priority? The planet, or the short-term grumblings of its shareholders.

The choice is yours on November 6.

Friday, October 13, 2017

Debunking Electoral Reform's "Urban" Myth

Proposed Reform Will Not Result In America's Biggest Cities Controlling The Presidential Election

October 13, 2017

The organization Equal Citizens is working to mount a court challenge to change how states allocate their Electoral Votes. Their proposed court case would not do away with the Electoral College (which would require a Constitutional Amendment), nor does it force states to award its Electors to the winner of the national popular vote (which would require action in many state legislatures and their governors). It would require states to distribute their electors in proportion to their own states' popular vote.

Detractors of this reform complain this would result in voters from a handful of cities and states deciding who becomes President. Let me show you why this is not so.

As of July 2015, there were 143 counties or county-equivalents (parishes, boroughs, independent cities, etc.) having populations of more than 480,000. At least 35 of the 50 states have at least one such county (36 if you count DC, and the Electoral College does, so I will). Collectively, a slight majority of Americans (160,720,317... 50.03%; ~11,000 more than half) lived in those counties. Let's call them "the top-half counties." The rest of America lives in not quite 3,000 other counties. Let's call those "the bottom-half counties."

  • Takeaway #1: Turning the fact above upside down, a majority of Americans live in counties having 500,000 people or less. Following election reform, anyone who would aspire to be President intuitively would need support in these communities, regardless of that candidate's level of support in high-population centers.
  • Takeaway #2: Politicians who decided to focus on this half of the population necessarily would be putting forth a material campaign effort in 70% of the states. That's far more than the roughly 20% (8-12) states that matter most for a winner-take-all Electoral College.

Breaking it down further, more than 1/8 of America (more than 40,000,000 people) lives in counties having a population of 50,000 or less.
  • Takeaway #3: With the proposed electoral reform, a politician who writes off 40-million rural Americans is worse off than a politician who takes a pass on 39,5-million Californians.

The argument that reform would enable large population centers to hold the key to the Presidency only could be true if electoral reform paved a path to the Presidency that allowed a candidate to win the office with a strong majority of the highly-urban vote and just a smattering of less-urban/rural vote. In other words, for the urban-bias theory to hold, the vote of the top-half counties would need to matter more to the final result than the vote of the bottom-half counties, even though the two sets of counties have equal population. Electoral math says that cannot happen.

First, in the 2016 election, the top-half counties accounted for 65.74 million of the 137.06 million popular votes cast for President... just short of 48 percent (despite having 50%+ of the country's people). Demographics explain this; the top-half counties generally have proportionally more children and non-citizen adults than the bottom-half counties.

Secondly, you still have the Electoral College... not the by-and-large winner-take-all Electoral College of today... but you still have states sending Electors to determine the Presidency. Thus, the top-half-bottom-half split of votes cast by state would matter to any analysis trying to determine if the result of reform would be urban bias. The following shows the number of ballots cast for President in 2016, by state and top/bottom-half county.

# of Presidential Popular Votes by State and County-Population Split

State Top ½ Bottom ½ EV
AK 0 318,608 3
AL 304,191 1,819,181 9
AR 0 1,130,635 6
AZ 1,989,478 615,183 11
CA 11,953,032 2,228,563 55
CO 1,476,412 1,303,808 9
CT 1,207,079 437,841 7
DC 311,268 0 3
DE 262,979 180,835 3
FL 6,021,848 3,480,899 29
GA 1,421,608 2,719,839 16
HI 285,790 143,147 4
IA 0 1,566,031 6
ID 0 690,433 4
IL 3,418,451 2,176,374 20
IN 569,680 2,188,285 11
KS 486,006 708,749 6
KY 353,100 1,571,050 8
LA 0 2,029,032 8
MA 2,776,351 548,695 11
MD 1,769,423 1,012,023 10
ME 0 743,941 4
MI 2,181,850 2,642,692 16
MN 953,120 1,992,113 10
MO 824,373 2,003,893 10
MS 0 1,211,088 6
MT 0 501,822 3
NC 1,257,886 3,483,678 15
ND 0 344,360 3
NE 240,433 603,794 5
NH 0 744,296 4
NJ 2,781,053 1,125,670 14
NM 274,662 523,657 5
NV 767,156 358,229 6
NY 5,080,906 2,640,889 29
OH 2,125,734 3,410,813 18
OK 520,996 931,996 7
OR 668,335 1,333,001 7
PA 2,967,667 3,199,062 20
RI 248,474 214,942 4
SC 215,165 1,887,862 9
SD 0 370,047 3
TN 586,451 1,921,576 11
TX 5,535,636 3,457,530 38
UT 627,385 516,216 6
VA 551,183 3,431,569 13
VT 0 315,067 3
WA 1,979,251 1,337,745 12
WI 750,407 2,225,743 10
WV 0 721,233 5
WY 0 255,849 3

65,744,819 71,319,584 538


Now suppose the Equal Citizens reform is enacted. Further suppose there is a 2-candidate race (Candidate A and B) where the same number of voters showed up to the polls in each county as 2016. Further suppose Candidate A were to win 75% of the votes in the top-half counties (extremely hard! see below) but just 25% of the votes in the bottom-half counties, with Candidate B winning the rest.

If top-half counties would be capable of exerting over-sized influence on the result of the Presidential election, this split of the vote would need to result in a White House win for Candidate A. However, the opposite actually is true. With more votes to be had in the smaller counties than the bigger ones, Candidate B wins by 2.6-million popular votes and 10 EV:

Candidate A: 75% Top ½ & 25% Bottom ½

Votes A Votes B EV A EV B
67,138,515 69,925,888 264 274


In order for Candidate A to win the popular vote, their support in bottom-half counties would need to be about 27%. That still doesn't get them over the hump in Electoral Votes.

Candidate A: 75% Top ½ & 27% Bottom ½

Votes A Votes B EV A EV B
68,564,904 68,499,499 266 272


What if A's bottom-half support was 29.9%? Not good enough (despite 4.2-million more popular votes)!


Candidate A: 75% Top ½ & 29.9% Bottom ½
Votes A Votes B EV A EV B
70,633,167 66,431,236 268 270
  

Candidate A would need a full 30% of bottom-half county support to secure the required Electoral Votes.


Candidate A: 75% Top ½ & 30% Bottom ½
Votes A Votes B EV A EV B
70,704,493 66,359,910 270 268


Now, do you think it's realistic for anyone to win 3/4 of the top-half county vote in a 2-person race? Hillary Clinton didn't do so in 2016... not nearly. In the top-half counties, Clinton garnered almost exactly five votes for every three cast for Trump. That's the equivalent of a 62.5%/37.5% split in a pure 2-person race. So, let's look at some scenarios where Candidate A's top-half county support is 62.5%.  

Again, with both halves being unequal for popular and Electoral-College purposes, someone with 5/8 of the top-half county vote to earn almost 4 in 10 votes from the bottom-half counties to win the White House. 40% is pretty significant support. Yes, 2016 wasn't a 2-person race, but Clinton failed to get 40% of the vote in 18 states, and Trump failed to get 40% of the vote in 10 states and DC.


Candidate A: 62.5% Top ½ & 37.5% Bottom ½
Votes A Votes B EV A EV B
67,835,356 69,229,047 262 276


Candidate A: 62.5% Top ½ & 38.5% Bottom ½
Votes A Votes B EV A EV B
68,548,555 68,515,848 266 272


Candidate A: 62.5% Top ½ & 39.6% Bottom ½
Votes A Votes B EV A EV B
69,333,066 67,731,337 270 268


  • Takeaway #4: Should Equal Citizens succeed in their aims, there is no scenario that would follow reform that would allow any candidate who succeeds wildly in high-population centers to become President without significant support from less-populated areas.

Sources:
County Population Data:
https://data.world/garyhoov/2016-pres-election-by-county

Voting Data By County:
same as sources used by https://uselectionatlas.org/

The author is not affiliated with Equal Citizens or the sources cited above.

Tuesday, October 3, 2017

Electoral Vote Allocation Alternative

A Lawrence Lessig article (https://medium.com/equal-citizens/the-equal-protection-argument-against-winner-take-all-in-the-electoral-college-b09e8a49d777) posed 4 options, in the form of questions, re: which candidates should be permitted an allocation of a state's Electoral Votes while best respecting 1-man-1-vote (including avoidance of throwing the choosing of the Presidency to the House of Representatives when no candidate receives 270 EV).
a) One candidate with most votes?
b) Two candidates with most votes?
c) All candidates whose share of the vote met or exceed (somewhere between 5%-15%) of votes cast?
d) All candidates whose share of the vote would round to a whole number of EV?

The article posits c) as the answer.

What about
e) a variant of c) which involves ranked-choice voting. Voters would be permitted a "first choice" and a "second choice." The state would tabulate the total number of occurrences of each choice combination of their voters. Where any candidates' first-choice votes fail to meet or exceed the chosen minimum percentage, the state would substitute the second-choices of their voters. Any votes where the second-choice candidate also does not meet the minimum percentage does not count.

Why? Because it maximizes the chance of each individual's vote becoming meaningful to their state's EV calculation while still minimizing the risk of throwing the election to the House of Representatives.

2016 example -- California.. % votes // unrounded EV // whole EV
EV under method c)
Clinton - 61.72% // 35.49 // 35
Trump - 31.62% // 19.51 // 20
Total - 93.34% // 55 // 55 (93.34% means 6.66% of CA voters, 1 in 15, would have no say)

Under method d)
Clinton - 61.72% // 34.40 // 34
Trump - 31.62% // 17.62 // 20
Johnson - 3.37% // 1.88 // 2
Stein - 1.97% // 1.09 // 1
Total - 98.68% // 55 // 55

Supposing the following:
Second choices of Johnson voters -- 50% Trump (1.69%), 40% Clinton (1.35%), 10% other.
Second choices of Stein voters -- 80% Clinton (1.58%), 10% Trump (0.20%), 10% other.

Under method c) modified for ranked choice voting...
Clinton - 64.65% // 36.22 // 36
Trump - 33.51% // 18.78 // 19
Total - 98.16% // 55 // 55 {leaving 1.84% w/o a say, much closer to d) than c)}

Monday, October 2, 2017

Alternative To The One-Game MLB Wild Card Round -- Weekend Of Truth

Background

Major League Baseball has a long tradition of playoff rounds set up as best-of-5 or best-of-7 games. Theory being... you play 162 regular season games, one single game shouldn't seal your fate.

Since the advent of a system where 5 teams per league make the playoffs, they've abandoned that. The two best teams in each league that don't win their division titles play a one-game playoff to determine two teams that will advance to the first 5-game-series round of the playoffs. Some don't like the do-or-die nature of that.

Proposal

I propose an alternative that respects the 162-game season, permits more than 4 teams per league to play in a meaningful post-season tournament where each round has 3 or more games... in such a way that you probably would not have to change the MLB Collective Bargaining Agreement.

Details


The 162-game regular season schedule shall be developed such that all teams would be scheduled to
* play Game 159 on the last Wednesday of September.
* play Games 160-162 on the Friday thru Sunday to follow.
* open the Thursday in between to be designated as a universal open date.

Determine the top 6 teams in each league at the end of the Game-159 Wednesday.  Any two-way tie for 6th place would be broken in a one-game tie-breaker on Thursday.  Ties for 2nd thru 5th place would be broken by regular-season statistics of MLB's choosing (i.e. better head to head record, net runs, etc).

Every team plays their scheduled Games 160-162 as and where the schedule-makers originally decided, except for the #3-#6 teams in each league and their scheduled opponents.

The #3-#6 ranked teams would begin their Weekend Of Truth (WOT) Series (instead of a one-game Moment Of Truth)... four series played to determine who advances to play in the Divisional Series round of the playoffs.

Team #6 would play at team #3, and #5 at #4 in each league.  All of these games count toward regular season statistical totals.

The teams that had been scheduled to be the opponents of these WOT teams would, instead, be rescheduled to have games against other teams whose original schedule was usurped by the WOT games.  These also count toward regular-season statistical totals.

Advancing from the WOT to the Division Series

Each WOT series will last at least three games (to keep all teams to a 162-game schedule). Other than that, it should be treated as a best-of-5 series where the home team (out of respect for their better regular season record) gets spotted a 1-0 series lead before the initial actual game of the WOT series. 

Thus, if the home team then wins at least two of the three initially-scheduled games against the visiting team, the home team advances.

If the visiting team sweeps all three initially-scheduled games, they advance.

If the visitor wins two of the three games held Friday-Sunday, the two teams play a do-or-die 4th game Monday.

Example:

Based on the standings at the end of September 28, 2017 (yes, that's a Thursday... but many teams hadn't played their 159th game on the real-life schedule until Thursday), the following would happen:

The Angels and Royals would be tied for 6th in the AL. The winner of a Thursday game between the two would visit the Red Sox on the weekend.
The Twins would visit the New York Yankees.
The Brewers would travel to Wrigley to face the Cubs.
The Rockies would play at the Diamondbacks.

The Angels/Royals, Twins, Brewers, and Rockies would need to win 3 games against their opponents to advance.
The Red Sox, Yankees, Cubs, and Diamondbacks only would need to win 2 games to advance.

To make these 8 teams opponents whole for a 162-game slate, the following teams (with their originally-scheduled opponents in parenthesis) would meet that Friday-Sunday.
The Tigers (MIN) would play the Blue Jays (NYY).
The Reds (CHC) would play the Cardinals (MIL).
With a Royals win...
...The Dodgers (COL) would play the Astros (BOS).
With an Angels win...
...The Astros (BOS) would play the Royals (ARI).
...The Dodgers (COL) would play the Mariners (LAA).