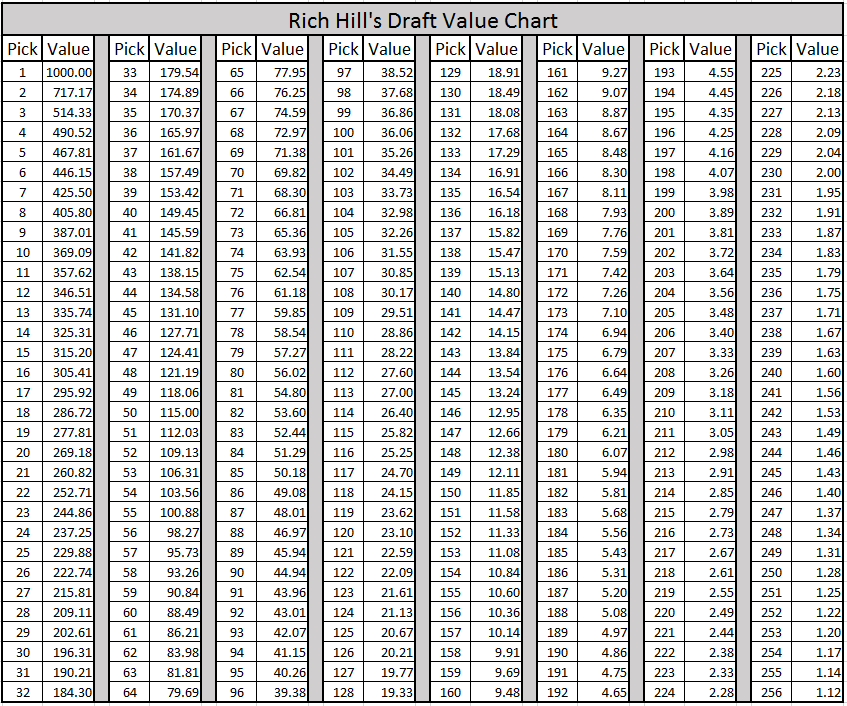
The trade values from the chart are not the be-all-end-all of trade values. As Hill explains in his article, each team uses variations of this chart. Also, trades into the Top 5 vary widely from year to year based on the perceived quality of the best-of-the-best draft-eligible college players (especially if one or more potential ''franchise quarterbacks'' are in the draft).
| # | Team A | Team B |
|---|---|---|
| 1 | ||
| 2 | ||
| 3 | ||
| 4 | ||
| 5 | ||
| 6 | ||
The following table indicates the cumulative point values of each team's draft picks as of February 23, 2019.
Number of picks includes compensatory picks.
Relative Power equals the team's cumulative point value divided by the league average.
Draft order is taken from tankathon.com and is subject to change based on trades.
| Team | Power Points | 2019 Picks | Relative Power |
|---|---|---|---|
| Arizona | 132665 | 11 | 230.3% |
| Oakland | 124491 | 10 | 216.1% |
| San Francisco | 100182 | 7 | 173.9% |
| Green Bay | 81443 | 10 | 141.4% |
| Tampa Bay | 73793 | 6 | 128.1% |
| Jacksonville | 72965 | 7 | 126.7% |
| New York Giants | 70054 | 10 | 121.6% |
| New York Jets | 67911 | 6 | 117.9% |
| Buffalo | 67893 | 10 | 117.9% |
| Detroit | 64553 | 9 | 112.1% |
| Denver | 63393 | 8 | 110.0% |
| Cincinnati | 62843 | 11 | 109.1% |
| Indianapolis | 58414 | 9 | 101.4% |
| Atlanta | 58012 | 9 | 100.7% |
| Cleveland | 57302 | 10 | 99.5% |
| Washington | 56842 | 9 | 98.7% |
| Carolina | 56758 | 7 | 98.5% |
| Miami | 55925 | 7 | 97.1% |
| New England | 52605 | 11 | 91.3% |
| Houston | 51451 | 7 | 89.3% |
| Minnesota | 49034 | 8 | 85.1% |
| Philadelphia | 48345 | 8 | 83.9% |
| Tennessee | 47806 | 6 | 83.0% |
| Pittsburgh | 46684 | 7 | 81.0% |
| Kansas City | 43113 | 8 | 74.8% |
| Baltimore | 40476 | 8 | 70.3% |
| LA Chargers | 37378 | 7 | 64.9% |
| Seattle | 34295 | 4 | 59.5% |
| LA Rams | 29817 | 7 | 51.8% |
| Dallas | 18375 | 6 | 31.9% |
| New Orleans | 10555 | 6 | 18.3% |
| Chicago | 8136 | 5 | 14.1% |
No comments:
Post a Comment